NeuroRank
ReportSeptember 22, 2026 · Research Report

The AI Visibility Index

Winning AI search recommendations in 2026.A study of 122 brands across ChatGPT, Gemini, Claude, and Perplexity: how often each model includes a brand when the prompt names it, and how often when it does not. The AI Visibility Index for 2026, and the AI search statistics behind it. 

Ambika Sharma

Ambika Sharma

Founder at Pulp Strategy Communications and NeuroRank.
Access the report

Complete the form to view the full report.

Country *

What the Study Found

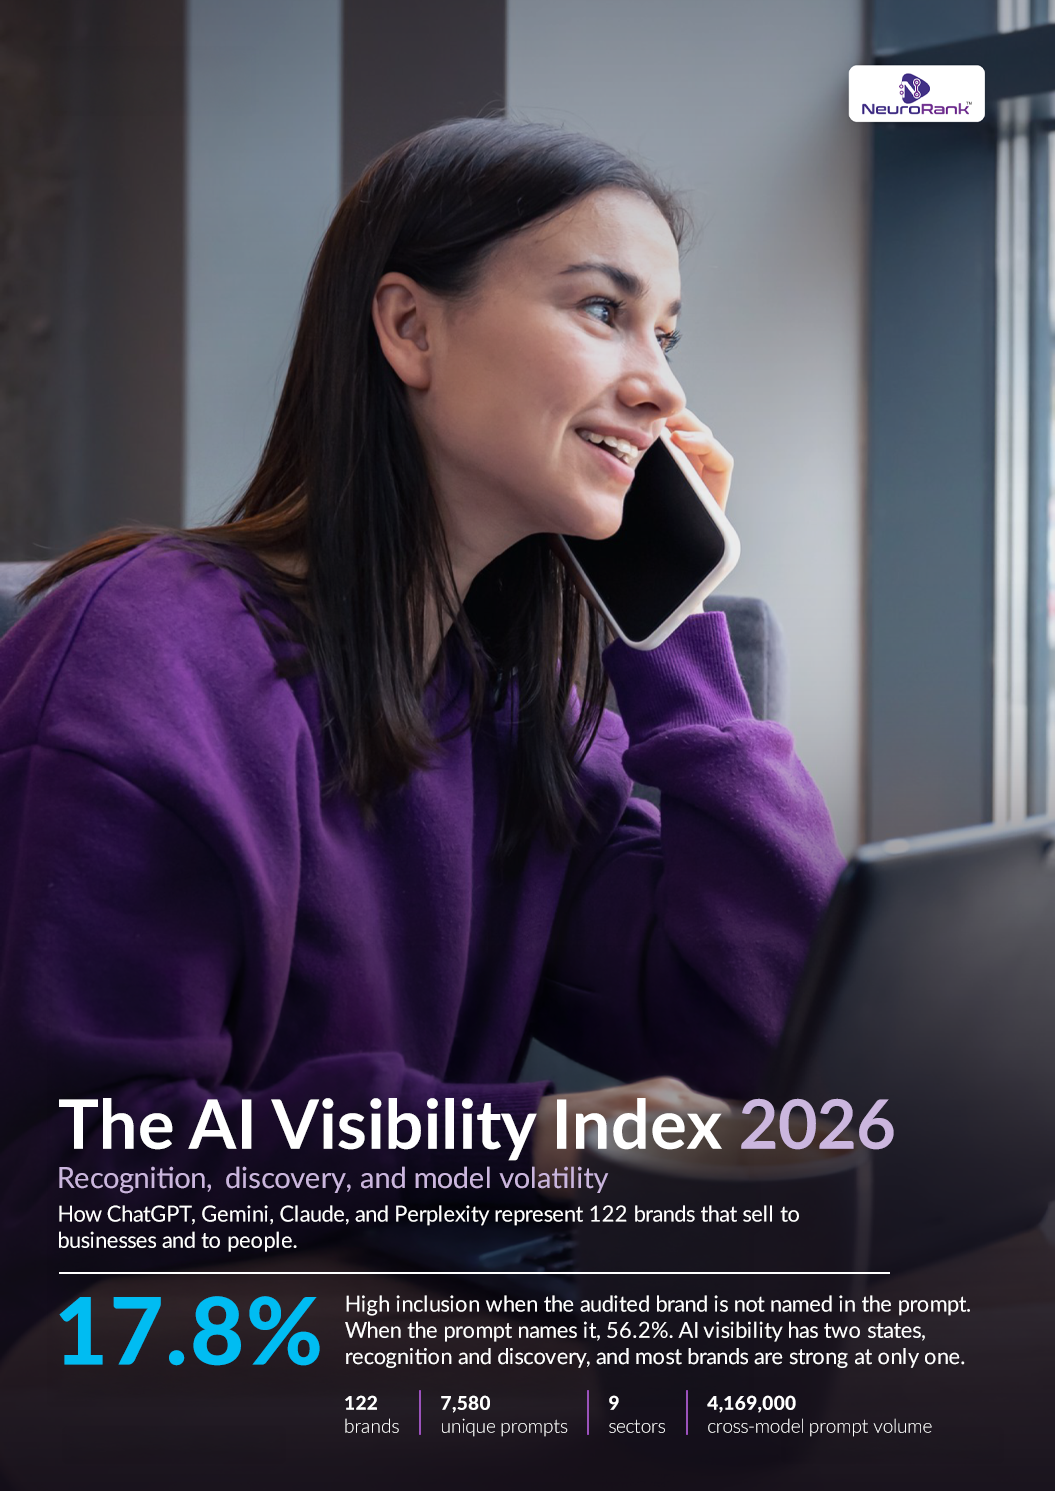
17.8%

High inclusion when the prompt does not name the brand

56.2%

High inclusion when the prompt names the brand

4,169,000

Cross-model prompt volume across ChatGPT, Gemini, Claude, and Perplexity Inside the Report

Inside the Report

What is inside the report

  • The two states of AI visibility. High inclusion is 56.2 percent when the prompt names the brand and 17.8 percent when it does not. The two come from separate prompt pools, so the report treats them as two states, not one blended score.

  • 51 of 82 are strong when named. Three are when they are not. Brand by brand, 51 of the 82 brands measured in both states reach 50 percent High inclusion when named, and 3 do when not.

  • Shortlist construction is the largest low-performing intent. Shortlist and recommendation prompts are 38.6 percent of unique prompts and record 20.0 percent High inclusion. Comparison prompts reach 48.4 percent, and most already name the brand.

  • The commercial gap is mostly a brand-cue difference. Commercial prompts look weaker overall, but on prompts that name no brand the two classes sit at 17.4 and 18.8 percent.

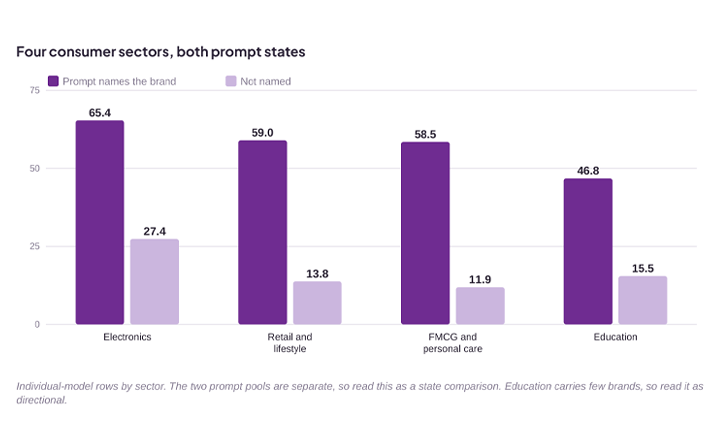
  • No sector reaches 30 percent when the prompt names no brand. All nine sectors show the same split, from 27.4 percent at the top to 10.2 percent at the bottom.

  • The four models disagree. Among the 63 brands measured on all four models, the median gap between a brand's best and worst model is 33.3 points.

  • Recognized but undiscovered. A map of discovery against model consistency that sorts brands into four groups for further investigation.

  • Readiness is associated with inclusion. Content readiness and High inclusion are positively associated at about r = 0.37, an association in this sample and not a tested effect.

  • A scoped source and error sample. In four financial services audits, 64.6 percent of 96 logged citations were third-party sources, and 61 error notes clustered on decision facts such as fees and rates.

  • Five research implications. How to measure and read AI visibility, stated as practice and as hypotheses to test, not as promised outcomes.

A look at the Pages

The AI Visibility Index — slide 1

Audience

Who should read this report

Written for the people accountable for how the brand is represented when a customer asks an assistant.

Brand and marketing leaders

See how four AI models include brands when a prompt names them and when it does not, sector by sector.

SEO, content and GEO teams

See where High inclusion is weakest by prompt class, and how content readiness is associated with inclusion.

PR and communications

See the scoped citation sample, where third-party sources made up 64.6 percent of logged citations in four financial services audits.

Digital and growth

See how often brands appear when the prompt names no brand: 17.8 percent across the study.

Compliance and risk

See which kinds of decision facts the captured answers got wrong in a four-audit financial services sample, from fees and rates to availability.

Founders and executives

One figure for where your category stands on discovery, across nine sectors.

Methodology

How this was measured

Sample

122 brands across nine sectors and 7,580 unique prompts. Per-model figures use the 83 brands with per-model data; the other 39 have combined results only.

Method

Each brand was audited across clusters of ten prompts, with 5,500 fresh-token prompt runs per prompt cluster, per country, between March and May 2026. Cross-model prompt volume: 4,169,000 prompt runs across ChatGPT, Gemini, Claude, and Perplexity.

Scoring

Each prompt and model received one High, Medium, or Low inclusion rating. Clear and Strong map to High; Sparse, Weak, Absent, and Minimal map to Low; Medium remains Medium. Where a response failed the brand, the applicable ORHL conditions were recorded: Omitted, Replaced, Hallucinated, or Zero Leads.

Limitations

Brand-named and brand-not-named prompts are separate prompt pools, so comparisons between them are state comparisons. The models were not tested on identical prompt panels, so cross-model differences are directional. Correlations are observed associations, not causes. The study measures how AI models represented brands; it does not measure sales, pipeline, traffic, conversion, or customer trust. Brands are reported in aggregate, not as a league table.

The AI Visibility Index methodology
FAQs

Questions about this report

Method, scope and how to use the findings.

1. Which brands are included?

-

122 brands across nine sectors. Per-model figures use the 83 brands with per-model data; the other 39 have combined results only. Findings are reported in aggregate, not as a league table of named brands.

2. What does the AI Visibility Index measure?

+

How often ChatGPT, Gemini, Claude, and Perplexity include a brand at the High level, on prompts that name the brand and on prompts that do not. It describes the category, not individual companies, and is refreshed annually.

3. What is the difference between recognition and discovery?

+

Recognition is High inclusion when the prompt names the brand: 56.2 percent. Discovery is High inclusion when the prompt names no brand: 17.8 percent. The two figures come from separate prompt pools, so the 38.4-point difference is a comparison of states.

4. Does a strong branded score mean my brand is safe?

+

No. Of the 82 brands measured in both prompt states, 51 reach at least 50 percent High inclusion when the prompt names them, and 3 do when it does not. A brand-named score describes the easier of the two states.

5. Which prompts are hardest for brands?

+

Shortlist and recommendation prompts, which ask a model to name options in a category. They are 38.6 percent of unique prompts, only 5.9 percent of them name the audited brand, and High inclusion on those rows is 20.0 percent.

6. How was the study measured?

+

7,580 unique prompts were run across ChatGPT, Gemini, Claude, and Perplexity between March and May 2026, at 5,500 fresh-token prompt runs per prompt cluster, per country: 4,169,000 prompt runs in total. Each prompt and model received one High, Medium, or Low inclusion rating.

7. Why did the study use fresh-token sessions?

+

So no answer was shaped by earlier conversation. Each run used a fresh authentication token and a new, context-isolated session, with no conversation history carried forward between runs.

8. Which AI models were included in the research?

+

ChatGPT, Gemini, Claude, and Perplexity, plus Combined Synthesis, an aggregate view across the four. Combined Synthesis is not a fifth model.

9. Why does reading all four models matter?

+

Because the models disagree. Among the 63 brands measured on all four models, the median gap between a brand's best and worst model is 33.3 points, and 41 of the 63 swing by at least 30 points.

10. Do the findings favor any one AI?

+

No. The models were not tested on identical prompt panels, so the report does not rank them. It reports how widely they disagree on the same brands.

11. How is a brand's AI visibility scored?

+

Each prompt and model receives one High, Medium, or Low inclusion rating. Where a response fails the brand, the applicable ORHL conditions are recorded: Omitted, Replaced, Hallucinated, or Zero Leads.

12. Are individual brands named or ranked?

+

No. Findings are reported in aggregate across the category. The AI Visibility Index measures the field, not named companies, so no individual brand is identified or ranked publicly.

13. Is there a version for my sector?

+

Yes. The research is also published by sector, with editions for financial services, B2B, B2C, consumer and retail, healthcare, and technology. For your own brand, NeuroRank Lite produces the same output.

14. How current are these figures?

+

They reflect the March to May 2026 audit window. AI systems change between releases, so the figures describe that window and are directional, not a permanent state. The Index is refreshed annually.

15. How do I get the report and apply it to my brand?

+

Download the full 18-page report from this page. To see the same analysis for your own brand across all four models, run NeuroRank Lite.

Analyze the Damage.
Establish Governance.